ECE488 Homework
Welcome! Notes for Spring 2022 Electronic Machines & Transformers course. Will make this more pretty as things evolve.
My goal is to make Electronic Circuits so easily digestible, you could teach a middle schooler. We'll see if this works.
Homework 1
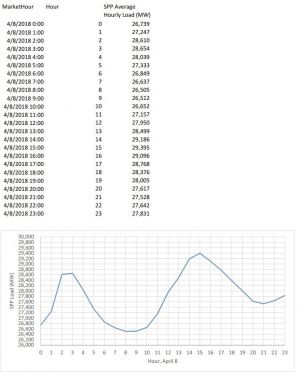
Average hourly load data for Southwest Power Pool (SPP) on April 8 is given in this document.
- Calculate the total energy supplied by SPP on this date.
- Calculate the peak load for SPP on this date.
- Why is the peak load significantly lower than in the class example (posted above)?

The numbers have been extrapolated from the
Average hourly load data for Southwest Power Pool (SPP) on April 8:
26739 || 27247 || 28610 || 28654 || 28039 || 27333 26849 || 26637 || 26505 || 26512 || 26652 || 27157 27950 || 28499 || 29186 || 29395 || 29096 || 28768 28376 || 28005 || 27617 || 27528 || 27642 || 27831Breakdown
- 1. In finding the total energy supplied by SPP on April 8, simply take the below listed values and multiply them by 1 hour, and then sum them together. The total energy supplied by SPP on this date is 666827 MWh.
- 2. The peak load listed on the chart is 29395 MW listed at hour 15 or so.
- 3. Peak load for the SPP is significantly lower in April 8 as opposed to August 8 example because it is typically colder during the April month throughout the region. It is known that heating/cooling is an electrically expensive process, and most midwestern homes are heated using natural gas burners (https://www.ncdc.noaa.gov/temp-and-precip/us-maps/1/202004#us-maps-select).