ECE488 Homework
Welcome! Notes for Spring 2022 Electronic Machines & Transformers course. Will make this more pretty as things evolve.
My goal is to make Electronic Circuits so easily digestible, you could teach a middle schooler. We'll see if this works.
Homework 1
Average hourly load data for Southwest Power Pool (SPP) on April 8 is given in this document.
- Calculate the total energy supplied by SPP on this date.
- Calculate the peak load for SPP on this date.
- Why is the peak load significantly lower than in the class example (posted above)?

The numbers have been extrapolated from the
Average hourly load data for Southwest Power Pool (SPP) on April 8:
26739 || 27247 || 28610 || 28654 || 28039 || 27333 26849 || 26637 || 26505 || 26512 || 26652 || 27157 27950 || 28499 || 29186 || 29395 || 29096 || 28768 28376 || 28005 || 27617 || 27528 || 27642 || 27831Breakdown
- 1. In finding the total energy supplied by SPP on April 8, simply take the below listed values and multiply them by 1 hour, and then sum them together. The total energy supplied by SPP on this date is 666827 MWh.
- 2. The peak load listed on the chart is 29395 MW listed at hour 15 or so.
- 3. Peak load for the SPP is significantly lower in April 8 as opposed to August 8 example because it is typically colder during the April month throughout the region. It is known that heating/cooling is an electrically expensive process, and most midwestern homes are heated using natural gas burners (https://www.ncdc.noaa.gov/temp-and-precip/us-maps/1/202004#us-maps-select).
Homework 2
Assume the total electric generation for a region in 2025 will be 11,000 GWh/day. Hydroelectric generation will provide 1,000 GWh/day. Nuclear will provide 2,000 GWh/day. Use the costs of generation for generators that start service in 2025 (table of data is below), calculate the total daily cost to generate if the rest of the energy is provided by:
a. 50% onshore wind, 50% solar PV
b. 50% ultra-supercritical coal, 50% combined cycle
c. 25% onshore wind, 25% solar PV, 25% ultra-supercritical coal, 25% combined cycle
Total System Levelized Cost of Energy (2019 $/MWh)
- Solar photovoltaic 35.74
- Geothermal 37.47
- Combined cycle 38.07
- Wind, onshore 39.95
- Hydroelectric 52.79
- Combustion turbine 66.62
- Ultra-supercritical coal 76.44
- Advanced nuclear 81.65
- Biomass 94.83
- Wind, offshore 122.25
Breakdown
We know that the total electric generation for a region in 2025 will be 11,000 GWh/day, and Hydroelectric/Nuclear will always provide a set amount (1,000/2,000 GWh/day respectively).
This means we only need to split the remaining sources evenly factoring the guaranteed sources. Also convert GWh to MWh for consistency of calculations.
a. 50% onshore wind, 50% solar PV
- Hydroelectric: 1000 GWh x $52.79/MWh = $52790000
- Nuclear: 2000 GWh x $81.65/MWh = $163300000
- Onshore Wind: 4000 GWh x $39.95/MWh = $159800000
- Solar PV: 4000 GWh x $35.74/MWh = $142960000
- Total cost per day: $518,850,000
b. 50% ultra-supercritical coal, 50% combined cycle
- Hydroelectric: 1000 GWh x $52.79/MWh = $52790000
- Nuclear: 2000 GWh x $81.65/MWh = $163300000
- Ultra-supercritical Coal: 4000 GWh x $76.44/MWh = $305760000
- Combined Cycle: 4000 GWh x $38.07/MWh = $152280000
- Total cost per day: $674,130,000
c. 25% onshore wind, 25% solar PV, 25% ultra-supercritical coal, 25% combined cycle
- Hydroelectric: 1000 GWh x $52.79/MWh = $52790000
- Nuclear: 2000 GWh x $81.65/MWh = $163300000
- Onshore Wind: 2000 GWh x $39.95/MWh = $79900000
- Solar PV: 2000 GWh x $35.74/MWh = $71480000
- Ultra-supercritical Coal: 2000 GWh x $76.44/MWh = $152880000
- Combined Cycle: 2000 GWh x $38.07/MWh = $76140000
- Total cost per day: $596,490,000
Homework 3
A power system is supplying 2000 MW of power for one hour from the following generating units:
- 500 MW nuclear (33% efficiency)
- 500 MW coal (Subbituminous coal in pulverized fuel steam plant; 33% efficiency)
- 200 MW natural gas (Combined-cycle gas turbine (CCGT) plant; 55% efficiency)
- 100 MW natural gas, (Open-cycle gas turbine (OCGT) plant; 35% efficiency)
- 600 MW wind
- 100 MW solar photovoltaic

The CO2 emissions from electric generators, by fuel type, are shown on the right.
The cost of fuel for the three types of generators are: Nuclear fuel: 0.44 $/mmBtu (mmBtu is 106 Btu) Coal: $1.50/mmBtu Gas: $3.40/mmBtu
This is the cost of fuel going into the plant, so you must use the efficiency of the plant to calculate cost of electricity out.
Calculate the total CO2 emissions and the total fuel cost for the hour.
Breakdown
We'll first calculate the CO2 emissions for the hour for the dataset.
Subbituminous Coal:

Combined-cycle gas turbine Gas:

Open-cycle gas turbine Gas:

Total CO2 Emissions: 1,360,755 lbs
Now we'll calculate the fuel costs for the hour for the dataset.
Nuclear:

Subbituminous Coal:

Combined-cycle gas turbine Gas:

Open-cycle gas turbine Gas:

Total Fuel Costs: $17,825.75
Homework 4
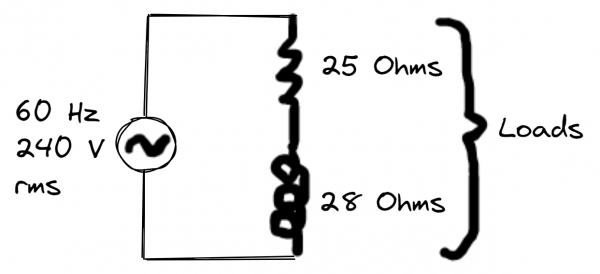
A load impedance consists of 25 ohm resistance in series with 38 ohm inductive reactance. The load is connected across a 60 Hz, 240 V rms source. Use the voltage source as the reference (zero phase angle).
- Draw the circuit diagram.
- Calculate the value of inductance.
- Calculate the phasor value of current through the load impedance.
- Which leads, current or voltage?
- What is the phase angle between current and voltage?
- Calculate the phasor value of voltage across the resistor.
- Calculate the phasor value of voltage across the inductive reactance.
Breakdown
1. Draw the circuit diagram.
2. Calculate the value of inductance.

3. Calculate the phasor value of current through the load impedance.

4. Which leads, current or voltage?
- With voltage source as reference, voltage leads current.
5. What is the phase angle between current and voltage?
- The phase angle is ϕ =

6. Calculate the phasor value of voltage across the resistor.

7. Calculate the phasor value of voltage across the inductive reactance.

Homework 5
An electric load consists of 5 Ω resistance, 20 Ω capacitive reactance, and 10 Ω inductive reactance, all connected in parallel. A voltage source of 100 V is applied across the load. Compute the following:
- The current of the load
- The real power of the load
- The reactive power of the load
Breakdown
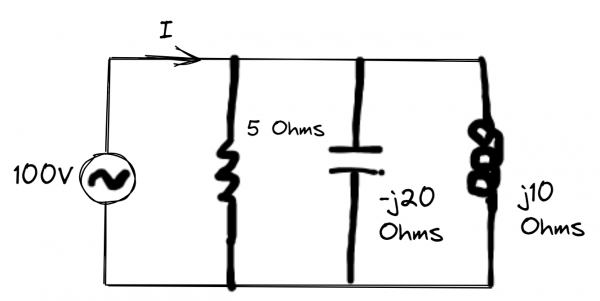
1) The current of the load

2) The real power of the load

Real power is .

3) The reactive power of the load
Reactive power is from above.

Homework 8
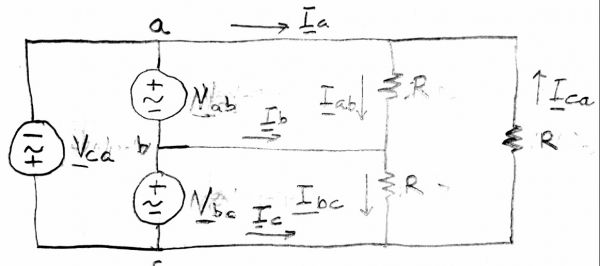
In the system shown, The voltages Vab, Vbc, and Vca are balanced three-phase with magnitude 208 V. The resistors R are 18 ohms.
- Calculate the currents Iab, Ibc, and Ica (Ohm's law)
- Calculate the power consumed by each resistor, and the total 3-phase power.
- Calculate the currents Ia, Ib, and Ic. (KCL)
Convert the delta source to a Y source. Convert the delta load to a Y load. Draw the single-phase equivalent for the circuit. Use the single-phase equivalent to calculation Ia. Its magnitude should be the same as part c.
Breakdown
1) Calculate the currents Iab, Ibc, and Ica (Ohm's law)

2) Calculate the power consumed by each resistor, and the total 3-phase power.

Power consumed by each of the shown resistors: 2.4kW Total power with the 3-phase:

3) Calculate the currents Ia, Ib, and Ic. (KCL)

4) Convert the delta source to a Y source. Convert the delta load to a Y load. Draw the single-phase equivalent for the circuit. Use the single-phase equivalent to calculation Ia. Its magnitude should be the same as part c.
a)

b)

c)
d)

e) Verification:
